STOCKS OR WATCHES?
Based on investing new money in mid-2024 and subsequent capital returns over the next 10 years, should you be heavily weighted in stocks or watches? We make our predictions for the future based on the current market situation, June 2024.
LUXURY WATCHES
The history of automatic Swiss luxury watches is generally that of a steadily rising quality stock with low volatility. However, there have been events like the quartz crisis where people thought every watch needed a battery and calculator in the 80s. This time gap aside, they are very stable and sought-after.
Two years ago, the market saw an unprecedented spike due to negative interest rates, Ukraine, Covid over-savings, undersupply, geopolitics and more. Just like stocks, when they are overbought due to short-term events that don’t change fundamentals, there will be a correction when the dust settles. In this case, an overcorrection at, e.g., Rolex, which, at the time of writing, as an index, is at the same level as when Covid entered the world (including a 4% price increase). If we include a few extra years, like the graph on the right, Rolex is below the normal increase they guarantee. Leaving aside the noise of the great ups and downs of the last three years, buying a Rolex watch is historically cheap compared to asking prices. Even at the index level, not just the selected models with which we primarily operate. The correction seems to have ended, and we can get back to the predictable and boring rises in watches, with plenty of room for upside and a risk/reward ratio somewhat better than two years ago.

STOCKS
If you look at stocks, like watches, they have been good investments over time. We consider luxury watches to be a valuable investment, so we compare them here with the US S&P 500.
We think of investing in watches as value investors, but stocks have several complex mechanisms built into them to measure and weigh momentum and whether it has the right value. One of the most important ratios for a value stock is the P/E ratio. In short, it is the share price (P=price) divided by the company’s earnings (E=earnings). If you have a share price of 1,000 and divide it by the company’s annual earnings of 100, you end up with a P/E of 10. It’s the bread and butter for all value investors, yet it tends to be overshadowed by growth expectations over time among many. We personally like to look at Shiller P/E, which is the same principle. The difference, however, is that Nobel Prize-winning economist Professor Robert Shiller came up with a ten-year average in earnings. This is to remove the noise of volatility, cyclicity, and inflation and instead focus on the fundamentals. Below is a graph with Shiller P/E, which looks historically at how expensive stocks are:
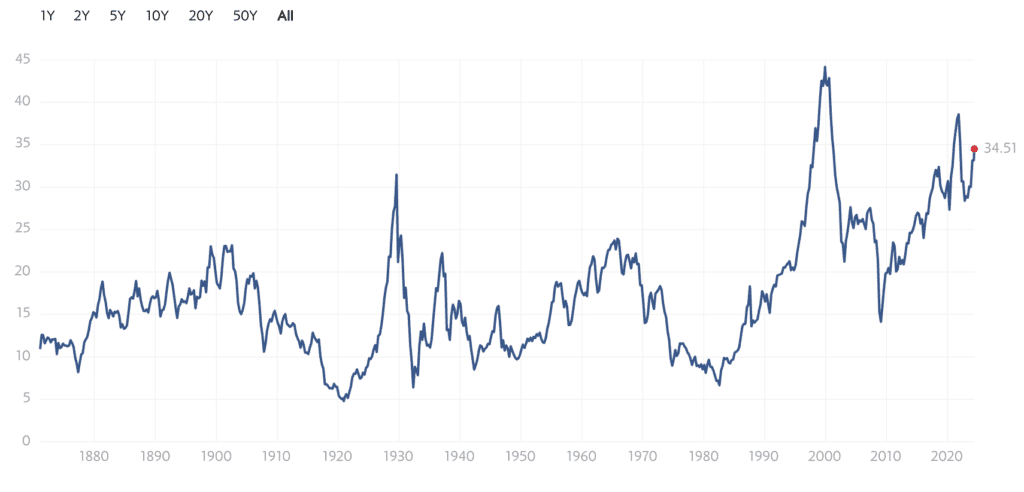
THE PRICE OF PROFIT
The median on the above graph has been 15.98 since the beginning of time, with a low of 4.78 in Dec. 1920, which was after WW1, and a peak of 44.19 at the IT bubble, Dec. 1999. Right now, the price of corporate profits is historically high, with a value of 34.51. We are in no hurry to call a bubble or spread panic but expect low returns on the stock market for many years to come. If you turn the graph upside down and push it forward a few years, it has historically been a very good predictor of returns in the coming years (reverse the trend).
World War I was followed by a huge boom known as “The roaring 20’s” (which later became “The great depression”), and the post-IT bubble party lasted until it was interrupted by the financial crisis and then Covid. All three followed an MSCI-world bull market of 139% over 61 months, 109% over 71 months, and 103% in 22 months from when the P/E value was lowest. The subsequent corrections from when the P/E value was highest were losses in value of 51%, 59%, and 29%.
RETURNS IN RELATION TO THE FUTURE
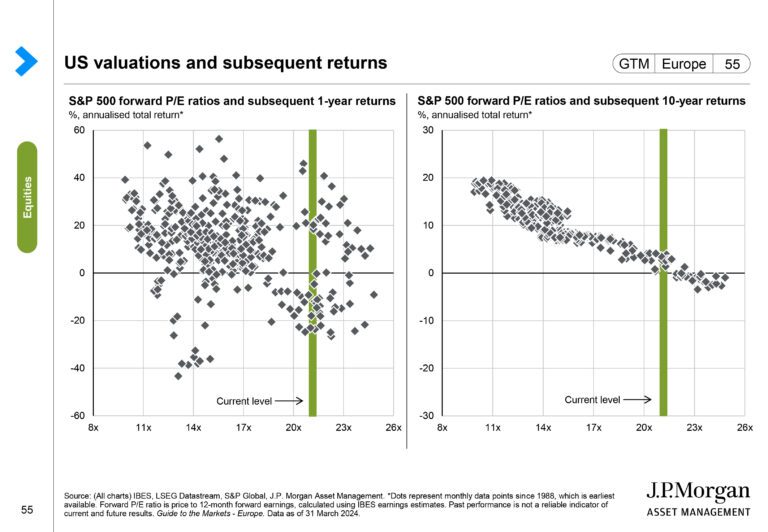
Here is a graph showing returns based on forward P/E value. On the left is a one-year return with a more scattered picture but with a trend. On the right, you have an annual return over 10 years, which gives a very clear picture. Buying at a price that is too high a P/E gives very low returns in the long run. You can visualize a horizontal movement of the green line (forward P/E) to see the % return at a given level.
(Source: JP Morgans 2024-Q1 rapport)
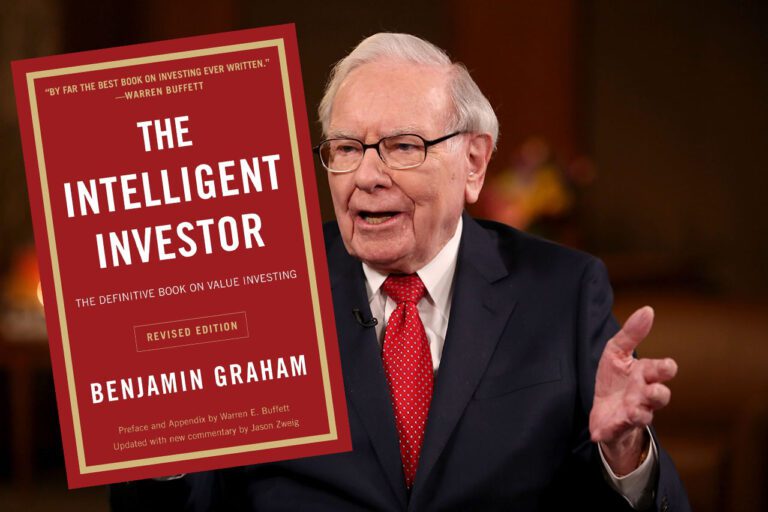
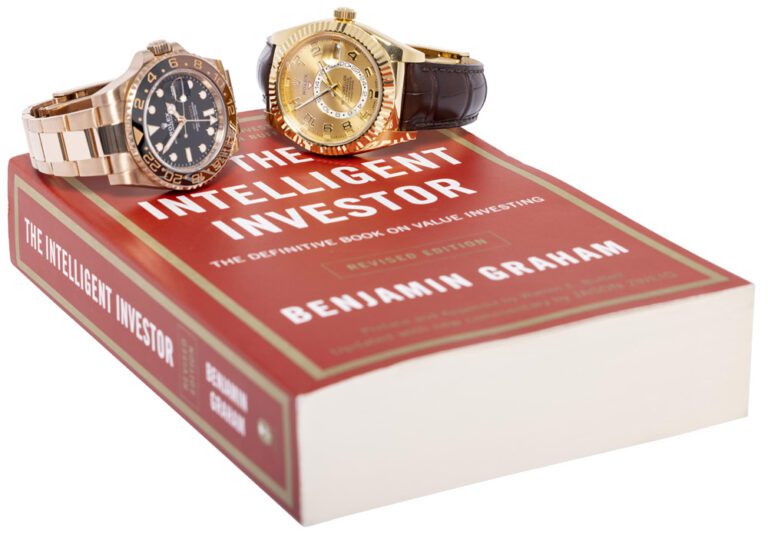
THE ORACLE AND THE BIBLE
The bible over them all for value investors is Benjamin Graham’s “The intelligent investor”. The book dictates that you should have no more than 25% in stocks at current levels. The rest has a better return on capital. The book is the cornerstone of value investor Warren Buffett’s investment strategy. He says of the book: “By far the best book on investment EVER written”. If we look at the “Oracle of Omaha”, who has historically been good at turning indicators into profits over a lifetime, his moves also show a little more caution. He has an all-time record cash position in Berkshire Hathaway, a testament to the difficulty of finding true value. Most recently, he sold $20,000,000,000 worth of Apple stock.
Scion asset management
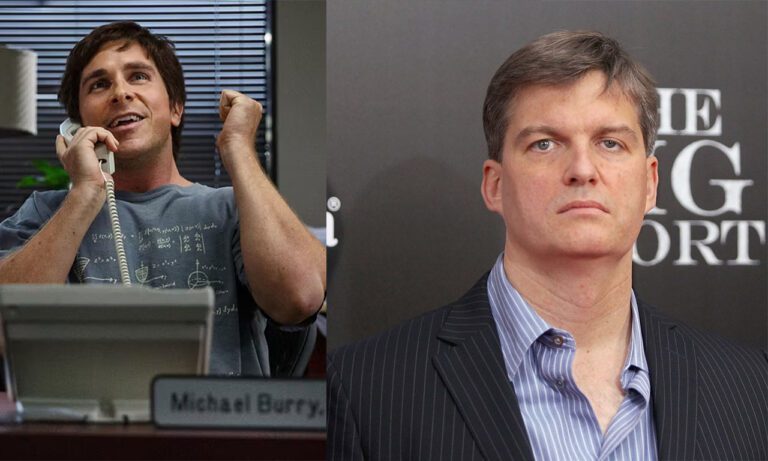
Another master of interpreting the market is Michael Burry, whom you may know as the man who predicted the financial crisis or Christian Bale’s role in “The Big Short”. The latest F13 (statutory portfolio disclosure) reveals that he has sold 100% of Google, Amazon, and 12 other positions out of 30. Instead, Chinese stocks (including the two largest positions JD.com and AliBaba) were purchased despite various geopolitical risks with China – in addition, the largest new position is in physical gold, despite the gold being right around the all-time high. Furthermore, approximately 56% of the funds are not visible. For Michael Burry, this will typically be short positions and cash holdings.
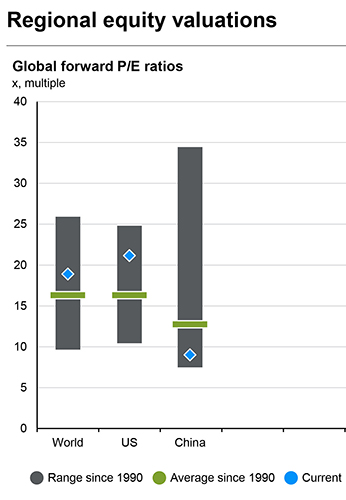
THE PRICE OF SHARES IN PERSPECTIVE
Looking at the Forward P/E, it’s not hard to find one indicator of why Michael Burry is willing to take on extra geopolitical risk in China, combined with a hedge in gold. The green line is the historical average forward P/E since 1990 (i.e., including the euphoria of the IT bubble and less than the historical average).
The blue square is the forward P/E, and the gray bar has been the spread since 1990.
Speaking of gold and China, China (and several others) are hoarding gold, which explains the high prices. Gold is typically a good place to escape when financial markets are high, but it also tends to fall along with fear when market concerns calm down.
IS THE PRICE RIGHT?
The market is priced for a blue sky (with no black swan), with a soft landing, falling interest rates, inflation under control, and continued stable growth. However, we are seeing other early-stage indicators, such as the explosion in freight rates, which can again play tricks on inflation. Perhaps you have to look a little further for the interest rate cuts that are on the horizon. Our current guess is a single 0.25% interest rate cut in June and then one more this year, not the 6-7 cuts that were priced at the start of the year.
If you ask professional investment advisors who trade stocks for a living, they say that quality outweighs risk and history. How you interpret the above data is up to you, but we hope that we can help inspire thought processes. The above considerations should not be used as investment advice but can be regarded as observations and interpretations of indicators that can be used for inspiration and consideration.
Book a no-obligation meeting, and we’ll be happy to tell you why we’re 100% in watches over other assets.
We will keep you updated
Sign up for our mailinglist: